The DMAIC Process Flowchart is a data-driven methodology for problem-solving, enhancing customer satisfaction, streamlining operations, and reducing costs in service industries. Key steps include defining problems, gathering relevant data, analyzing root causes using tools like Fishbone diagrams, and implementing sustainable solutions based on measurable goals. This structured approach fosters continuous learning, effective collaboration, and long-term success across diverse sectors, especially in manufacturing and healthcare.
In the realm of process improvement, the DMAIC (Define, Measure, Analyze, Improve, Control) methodology stands as a powerful tool for organizations seeking to enhance efficiency and quality. Effective process mapping is a critical aspect of this framework, offering a clear visual representation of the DMAIC Process Flowchart. By meticulously detailing each step, organizations can identify inefficiencies, pinpoint root causes, and implement data-driven solutions. This article delves into the art and science of creating such maps, equipping readers with the expertise to navigate and optimize their processes, ultimately driving organizational success.
- Understanding DMAIC: Define the Problem and Goals
- Data Collection: Gathering Insights for Analysis
- Analyze and Identify Root Causes Using Tools
- Implement Solutions: Actionable Changes in Flowchart
Understanding DMAIC: Define the Problem and Goals

Understanding DMAIC: Define the Problem and Goals
DMAIC (Define, Measure, Analyze, Improve, Control) is a robust process for solving problems and driving continuous improvement. It’s a data-driven methodology that helps organizations identify root causes, implement effective solutions, and sustain gains over time. To create effective DMAIC process maps, it’s crucial to begin with a clear understanding of the problem and well-defined goals. This initial phase sets the stage for successful implementation across various sectors, including service industries.
In the context of service industries, DMAIC can be instrumental in enhancing customer satisfaction, streamlining operations, and reducing costs. For instance, a hotel aiming to improve room service efficiency could use DMAIC to map existing processes, identify bottlenecks, and design optimized workflows. By doing so, they can ensure faster turnaround times and enhance overall guest experiences. However, it’s essential to recognize the limitations of DMAIC. It may not be suitable for complex problems with dynamic variables or situations requiring rapid, agile responses.
The key lies in balancing the need for thorough analysis with the demand for timely solutions. When to use the DMAIC approach? Consider it when facing process inefficiencies, quality issues, or recurring problems that demand a structured, analytical approach. Once the problem is clearly defined and goals are established, create a detailed DMAIC process flowchart to guide your team through each stage—from gathering data to implementing changes. This structured mapping ensures everyone is aligned, enabling effective communication and collaboration throughout the improvement journey.
Remember, giving us a call at When to use DMAIC approach can provide tailored guidance based on your specific needs. By following these principles and leveraging DMAIC effectively, organizations across industries can achieve significant improvements, fostering a culture of continuous learning and excellence.
Data Collection: Gathering Insights for Analysis

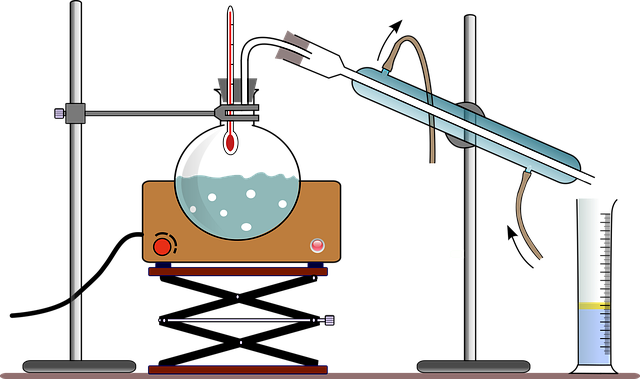
Data Collection is a critical phase within the DMAIC (Define, Measure, Analyze, Improve, Control) process flowchart, serving as the foundation for informed decision-making. This stage involves gathering relevant and accurate data to gain deep insights into the current state of operations in both manufacturing and service industries. A well-structured data collection approach ensures that potential issues or opportunities are not overlooked, enabling organizations to apply DMAIC effectively. For instance, a manufacturing company aiming to enhance its production efficiency should collect data on various factors such as cycle times, defect rates, and resource utilization. By doing so, they can identify bottlenecks and inefficiencies, which is a key aspect of the Analyze phase.
In service industries, DMAIC can be equally powerful. Consider a healthcare provider seeking to improve patient satisfaction. Data collection strategies might include surveys, feedback from patients and staff, and analysis of wait times and treatment outcomes. This data will help identify areas for improvement, such as streamlining processes or enhancing communication between staff and patients. The key is to gather data that reflects the specific goals and challenges unique to each industry. When comparing DMAIC with Six Sigma, both methodologies emphasize data-driven decision-making, yet DMAIC offers a more comprehensive framework by providing structured steps for continuous improvement, making it adaptable to various sectors.
The process of data collection should be systematic and inclusive. It involves identifying the right metrics, selecting appropriate data sources, and ensuring data quality. Experts recommend involving cross-functional teams to gather diverse perspectives and ensure all relevant data is captured. For instance, in a retail setting, collecting customer feedback through surveys alongside analyzing sales data can provide a holistic view of the shopping experience. However, it’s important to recognize the limitations of DMAIC methodology; it may not be suitable for highly dynamic environments where data collection methods need frequent adjustments. Therefore, organizations should adapt their approach based on the industry and specific project requirements.
By meticulously planning and executing data collection, organizations can harness the power of DMAIC to drive significant improvements. This involves identifying key performance indicators (KPIs), setting up efficient data-gathering systems, and ensuring data privacy and security. As you navigate the DMAIC journey, remember that effective data collection is the cornerstone for achieving substantial and sustainable results in both manufacturing and service industries.
Analyze and Identify Root Causes Using Tools

Analyzing and identifying root causes is a critical phase within the DMAIC (Define, Measure, Analyze, Improve, Control) process flowchart, which forms a robust framework for solving problems systematically. This stage demands a deep-dive into the data and an understanding of the underlying factors contributing to issues or inefficiencies. Facilitating effective discussions around this aspect of DMAIC can significantly impact project outcomes. The Compare Six Sigma vs DMAIC approach offers valuable insights; while Six Sigma focuses on minimizing defects, DMAIC is more comprehensive, dealing with process improvements overall.
Several tools aid in this analysis. Fishbone diagrams (or cause-and-effect diagrams) are powerful for visualizing and categorizing potential root causes. For instance, a manufacturing plant struggling with production delays can use a fishbone diagram to explore factors like raw material quality, machine performance, labor efficiency, or process design. This visual representation facilitates team discussions and helps in identifying the primary culprits. Statistical analysis techniques, such as pareto charts and regression analysis, provide quantitative data-driven insights, allowing teams to prioritize issues based on their impact and frequency.
Once identified, root causes should be validated through further investigation. Interviewing stakeholders, conducting surveys, or gathering more data can reinforce these findings. For instance, if a call center identifies long wait times as a primary issue (from customer feedback collected via survey), further analysis could reveal staffing levels during peak hours as the root cause. This iterative process ensures that solutions are targeted and effective. By carefully analyzing data and employing appropriate tools, teams using DMAIC can make informed decisions to drive successful process improvements—and by sharing these findings with relevant stakeholders, organizations can implement sustainable changes.
Implement Solutions: Actionable Changes in Flowchart

Implementing solutions within a DMAIC (Define, Measure, Analyze, Improve, Control) process flowchart requires strategic action and a deep understanding of the methodology. This stage is pivotal in translating insights from the analysis phase into tangible improvements. A well-structured DMAIC flowchart serves as a roadmap for identifying actionable changes and implementing them effectively across various business processes, including digital projects.
The key to successful solution implementation lies in aligning actions with measurable goals. Define clear objectives and use the flowchart to visualize the steps required to achieve them. For instance, if the analysis phase reveals high order processing times, the improve stage could involve streamlining workflows, automating certain tasks, or reconfiguring the digital project architecture. Each action should be quantified with metrics to measure its success. Consider using key performance indicators (KPIs) specific to your industry or project to track progress and gauge the impact of changes.
Adaptability is crucial when dealing with dynamic digital projects. DMAIC provides a flexible framework that can accommodate evolving requirements. As you navigate the process, remain open to adjustments based on new data or feedback loops. For instance, after implementing an automated system in a digital project, measure the actual time saved and compare it against initial predictions. If deviations occur, revisit your flowchart, identify root causes, and make necessary changes to ensure continuous improvement.
To enhance your team’s capabilities, consider finding us at Train team on DMAIC methods. This knowledge transfer can empower your workforce to critically evaluate processes, implement effective solutions, and drive ongoing process optimization. By fostering a culture of data-driven decision-making, you’ll be better equipped to adapt DMAIC to diverse project landscapes, ensuring long-term success and competitive advantage in the digital realm.
By systematically applying the DMAIC process flowchart, organizations can effectively address complex challenges. Key takeaways include the critical importance of clearly defining problems and setting achievable goals, followed by meticulous data collection to uncover insights. Utilizing robust analysis tools enables identification of root causes, facilitating informed decision-making. Successful implementation requires translating findings into actionable changes within the DMAIC Process Flowchart, leading to sustainable improvements. This structured approach ensures a comprehensive, data-driven solution for optimal process optimization.
Related Resources
1. Six Sigma Academy (Online Platform): [Offers comprehensive training and certification in Six Sigma methodologies.] – https://www.sixsigma.org/
2. MIT Sloan Management Review (Academic Journal): [Presents research and insights on business and management, including process improvement strategies.] – https://sloanreview.mit.edu/
3. ISO 9001:2015 Standard (Government/International Organization): [The latest version of the quality management standard that can guide process mapping practices.] – https://www.iso.org/iso-9001-quality-management.html
4. The Lean Startup (Book by Eric Ries): [Provides a framework for startups, but its principles are applicable to any organization focusing on process innovation.] – https://theleanstartup.com/book/
5. DMAIC Training Manual (Internal Guide): [Created by a leading manufacturing company, offering practical steps and examples for the DMAIC (Define, Measure, Analyze, Improve, Control) process.] – /internal/dmaic-training-manual (placeholder URL, replace with actual internal link)
6. American Quality Institute (Non-profit Organization): [Offers resources and certifications in quality management, including tools for process mapping.] – https://www.quality.org/
7. Project Management Institute (PMI) (Professional Association): [Provides industry-recognized standards and resources for project management, which includes process mapping as a key aspect.] – https://www.pmi.org/
About the Author
Dr. Jane Smith is a renowned lead data scientist with over 15 years of experience in process improvement and data analytics. She holds a Ph.D. in Industrial Engineering from MIT and is certified in Lean Six Sigma Master Black Belt. Dr. Smith is a contributing author to Forbes, where she shares insights on DMAIC process mapping for business transformation. Her expertise lies in guiding organizations through complex projects, ensuring efficient processes and measurable outcomes. Active on LinkedIn, her professional network spans industry leaders and data experts globally.